


Every garment factory has hidden efficiency losses — in throughput, in operator idle time, in production line bottlenecks nobody has measured. This self-assessment checklist is built on the methodology our experts have developed over 45+ years of auditing sewing factories worldwide. Use it to find where your production is losing money before it costs you another quarter.
Most factory owners know something isn't right — output should be higher, lead times should be shorter, defect rates should be lower. But "something isn't right" isn't actionable. You need a structured garment factory audit to know where the losses are hiding.
This self-assessment covers the same ground as a professional production efficiency analysis: workforce structure and retention, sewing line balancing, facility layout optimization, task distribution, quality control systems, management maturity, and capital planning. These are the questions we ask when we walk onto a factory floor — and the answers tell us exactly where the 20%, 50%, or even 200% improvement in garment production efficiency is hiding.
Whether you're a factory owner preparing for growth, a production manager hunting bottlenecks in your sewing line, or a brand evaluating an apparel manufacturing partner — work through these honestly. The questions you can't answer are often more revealing than the ones you can.
Part 1: Organizational Baseline
Before diving into production details, you need a clear picture of who you are and what you're working with.
Respondent Information
Who is filling out this assessment matters. Ideally, the person answering should have direct visibility into production operations — a factory manager, production director, or IE (Industrial Engineering) lead. If senior leadership fills this out without input from the floor, the answers tend to be optimistic.
Company Overview
Document your basics: company name, representative, address, capital stock, foundation date, annual revenue. This isn't just paperwork — your revenue relative to your workforce size is one of the quickest indicators of overall efficiency.
Why it matters: A factory with 200 sewing operators generating the same revenue as a factory with 100 operators has a fundamental productivity problem that no amount of new equipment will fix.
Company Organization — Workforce Structure
Map out your entire workforce by department and gender:
| Department | Female (FT) | Female (PT) | Male (FT) | Male (PT) | Total |
|---|---|---|---|---|---|
| Executive | |||||
| Administration | |||||
| Sales | |||||
| Cutting | |||||
| Sewing | |||||
| Finishing | |||||
| Maintenance | |||||
| Inspection | |||||
| IE | |||||
| Other |
Also count your team leaders and managers (supervisors, section chiefs, department heads) separately.
What to look for:
- Sewing-to-support ratio: In a well-run factory, 70–80% of the workforce should be in direct production roles (cutting, sewing, finishing). If your admin and support staff ratio is creeping above 25%, investigate why.
- Maintenance and IE staff: These are often the first departments to be cut when budgets tighten, but they have outsized impact on productivity. Having zero IE staff usually means nobody is measuring or improving process efficiency.
- Manager-to-operator ratio: One team leader per 15–25 operators is typical. Too few means problems go unnoticed; too many means overhead is eating into your margins.
Labor Overview
- Working days per year
- Working hours per day
- Starting pay per month
- Average wage
- Bonus structure (frequency and amount)
Why it matters: Working hours × working days × number of operators = your total available production capacity. If you don't know this number precisely, you can't plan capacity or quote lead times accurately.
Part 2: Workforce Stability & Retention — The Hidden Cost of Operator Turnover
High turnover is the silent killer of garment production efficiency. Training a new sewing operator to full efficiency takes 3–6 months. Every time someone leaves, you lose that investment — and the real cost of operator turnover is far higher than most factory managers calculate.
Average Length of Service
Where does your workforce fall?
- ☐ Less than 3 years
- ☐ 3–4 years
- ☐ 5–6 years
- ☐ Over 7 years
Benchmark: If most of your operators have been with you less than 3 years, your training costs are significantly eating into your margins — even if you don't track them as a line item. Factories with average tenure over 5 years typically achieve 15–20% higher efficiency than those with high turnover.
Average Age of Employees
Track the average age for both male and female employees, and note the trend: is your workforce aging, staying stable, or getting younger?
What to watch for:
- Aging workforce with no young hires: You're facing a succession problem. Who will replace your experienced operators in 5 years?
- Very young workforce: You likely have a training gap. Young operators need structured skill development — not just "sit next to an experienced person and learn."
- Declining average age: This could mean high turnover among experienced workers, which is a warning sign even if your headcount looks stable.
Average Attendance Rate
What is your average attendance rate as a percentage?
Benchmark: 95% or above is healthy. Below 90% is a serious problem that directly impacts your daily output, your ability to meet deadlines, and your line balancing. A factory running at 85% attendance effectively has a different production capacity every single day.
Attendance Rate Stability
Is your attendance rate:
- ☐ Stable
- ☐ Unstable
An unstable attendance rate is worse than a consistently low one, because you can plan around a known shortfall but not around an unpredictable one. If attendance spikes and dips, dig into why: seasonal patterns, payday effects, specific departments, specific days of the week.
Part 3: Compensation & Incentive Design
How you pay your operators directly affects their motivation, retention, and the kinds of production systems you can implement.
Wage Structure for Sewing Operators
Which applies to your factory?
- ☐ Daily wage
- ☐ Daily wage with monthly pay
- ☐ Monthly pay (salary)
- ☐ Piece-rate pay
- ☐ Other
Trade-offs to consider:
- Piece-rate pay drives individual speed but can destroy quality and make teamwork-based production systems (like one-piece flow) nearly impossible. Operators on piece rate resist helping neighbors, resist learning new processes, and resist layout changes.
- Monthly salary gives you flexibility to implement group-based systems and cross-training, but removes individual performance incentives.
- Hybrid systems (base salary + group performance bonus) often work best for factories trying to modernize their production systems.
Incentive Pay System
Do you have any form of incentive compensation?
- ☐ Based on overall company performance
- ☐ Based on team/group performance
- ☐ Individual piece-rate for each operator
- ☐ No incentive system, but planning to start one
- ☐ No need for an incentive system
Key insight: The most effective incentive systems in modern garment production are team-based, not individual. When the incentive is tied to the team's output, operators naturally help each other through bottleneck processes, share skills, and maintain quality — because a defect that causes rework hurts everyone's bonus.
Part 4: Production Systems & Flow — Batch, One-Piece, or Group Work?
This is where you get into the specifics of what you make and how you make it. Your choice of production system directly determines your lead times, WIP levels, and how much flexibility you have when orders change.
Production Items
List every product category you manufacture with these details:
| Item | Daily Output/Operator | Processing Fee/Unit | Retail Price | Order Lot Size | Daily Total Output | Client |
|---|---|---|---|---|---|---|
| e.g., Men's dress shirt | 12 pcs | $3.50 | $45 | 500 pcs | 240 pcs | Brand X |
Why this level of detail matters: Your "daily output per operator" is your single most important productivity metric. If you can't fill in this column, you don't have visibility into your own efficiency. Compare across product categories — the variance will tell you where your operation is strong and where it struggles.
In a professional audit, this is where the Product Model Assessment begins — your top 3–5 SKUs go under the microscope. The auditor builds a complexity scorecard for each product and identifies the SMV (Standard Minute Value) gaps between your current process and an optimized one. The delta between those two numbers is your improvement opportunity.
Number of Lines and Personnel
For each sewing line, record the number of operators and what they're producing.
What to look for:
- Line size variation: Are some lines 30 operators and others 8? Wide variation suggests you're reacting to orders rather than designing your production system.
- Operators per line vs. product complexity: A basic t-shirt shouldn't need the same line size as a structured blazer. If it does, your process distribution needs work.
Item Changeovers per Month
How many times per month does each line switch to a different product?
- ☐ Once
- ☐ 2–3 times
- ☐ 4–5 times
- ☐ 6–10 times
- ☐ 11–15 times
- ☐ 16–20 times
- ☐ 20–30 times
- ☐ Over 31 times
Critical context: Every changeover costs you production time. A factory doing 20+ changeovers per line per month is spending a significant portion of its capacity on setup, re-training, and the learning curve. If your clients are demanding frequent small lots, you need to either price that into your processing fee or invest in systems that reduce changeover time (pre-prepared process organization charts, standardized layouts, multi-skilled operators).
Sample Production
Do you produce samples in-house? If yes, why?
- ☐ Submit to client
- ☐ Pattern correction
- ☐ Evaluation of sewing method
- ☐ Operator reference
- ☐ Estimation of number of processes
Best practice: The best factories use sample production not just as a client requirement, but as a planning tool. Making a sample to estimate the number of processes and evaluate sewing methods before production starts means you can build your Technological Process Outline (TPO) and Labor Distribution Scheme (LDS) in advance — not improvise them during the first 2 days of a run. These two documents are the foundation of every professional production audit, and the factories that already have them are the ones that improve the fastest.
Production System
What system does your factory use?
| Batch Flow | One-Piece Flow | Group Work (3–5 workers) | |
|---|---|---|---|
| Parts | ☐ | ☐ | ☐ |
| Assembly | ☐ | ☐ | ☐ |
Understanding the options:
- Batch flow (bundle system): The traditional approach. Cut pieces are bundled, and each bundle moves through the line process by process. Simple to manage, but creates large work-in-progress (WIP) inventory and long lead times.
- One-piece flow (synchronized system): Each garment moves individually through the line without waiting in a bundle. Dramatically reduces WIP and lead time, but requires balanced process distribution and skilled operators who can maintain pace.
- Group work system: Small teams of 3–5 operators handle all processes for a garment section. Requires multi-skilled operators but offers extreme flexibility for small lots and frequent changeovers.
Reality check: Many factories check "batch flow" because it's what they've always done. If you're struggling with long lead times, high WIP inventory, or difficulty meeting small-lot orders, your production system itself may be the constraint — not your operators or equipment.
Average Batch Size
If you use batch flow, what's your typical batch size? And is it:
- ☐ Determined by cutting batch (passed directly from cutting)
- ☐ A fixed batch size set by production management
Why it matters: If your sewing batches are whatever size comes from cutting, your sewing floor is being controlled by your cutting room — not by your production plan. Setting a deliberate batch size (even within a batch flow system) gives you more control over WIP levels and throughput time.
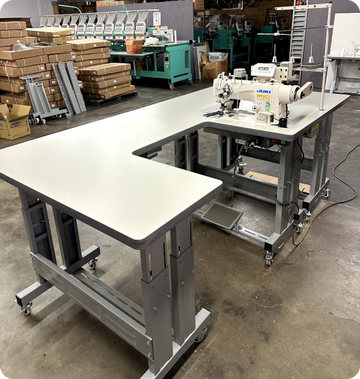
Part 5: Sewing Line Layout Optimization & Operator Allocation
Your factory layout and how you allocate people to machines and processes determines the upper limit of your garment production efficiency. This is the area where professional auditors spend the most time on the factory floor — studying facility layout, sewing line orientation, operator movement paths, and task distribution to find where non-value-added time is hiding.
Layout Change Frequency
How often do you rearrange your sewing floor?
- ☐ Once or twice a week
- ☐ Once or twice a month
- ☐ Once every 2–3 months
- ☐ Once or twice a year
- ☐ Never
The uncomfortable truth: If you never change your layout, your layout is optimized for products you made years ago — not what you're making today. The best factories adjust their layout when product mix changes significantly. This doesn't mean moving every machine — it means being willing to rearrange the flow when the product demands it.
Conversely, if you're changing layout weekly, you're spending too much time on setup. This usually means your production system isn't flexible enough to handle variety without physical reorganization.
Pro tip: Draw your current layout on paper, then trace the path a single garment takes from first cut piece to finished product. This "spaghetti diagram" of operator movement will immediately reveal wasted travel, unnecessary handoffs, and throughput constraints you can't see just by standing on the floor.
Backup Equipment Ratio
What percentage of your machines are spares/backups?
- ☐ 0–9%
- ☐ 10–20%
- ☐ 20–30%
- ☐ Over 30%
Benchmark: 10–20% backup equipment is healthy. Below 10% means a single machine breakdown can stop a process entirely. Above 30% means you have significant capital sitting idle — either you're overstocked or your maintenance program isn't keeping production machines running reliably.
Machine Assignment
Are sewing machines assigned to individual operators?
- ☐ Yes, each operator has their own machine
- ☐ Generally assigned (but may share)
- ☐ No, operators use whichever machine is available
Connection to maintenance: When operators "own" their machine, they tend to take better care of it — daily cleaning, reporting issues early, keeping their workspace organized. When machines are shared, nobody takes responsibility and maintenance problems accumulate.
Multi-Skill Training
Are your operators being trained to handle multiple processes?
- ☐ Yes
- ☐ No, they are single-skilled
This is the most strategically important question in this section. Single-skilled operators are a bottleneck factory. When one person is absent, that entire process stops — and the operators on either side of them have nothing to do. Multi-skilled operators can cover for absent colleagues, be reassigned when the product changes, and help balance the line when one process is slower than others.
If you answered "No," this is likely your highest-leverage improvement opportunity.
Average Processes per Operator
How many different processes can each operator handle?
Benchmark by production system:
- Batch flow factory: 2–3 processes per operator is a reasonable starting goal
- One-piece flow: 4–6 processes per operator is typically needed
- Group work system: Operators should be able to handle all processes in their group
Total Number of Processes
How many individual processes are in your main product?
This number combined with Q22 tells you your coverage ratio. If your main product has 40 processes and each operator handles 2, you need at least 20 operators with zero flexibility. If each handles 5, you need 8 operators with significant flexibility for rebalancing.
Process Rotation
Do you rotate operators between processes? If yes, how often?
- ☐ More than once a month
- ☐ Every 1–2 months
- ☐ Every 3–5 months
- ☐ Every 6+ months
- ☐ No rotation
Why rotation matters: Regular process rotation is how you build and maintain multi-skilled operators. Without it, skills atrophy. An operator who was trained on a process 6 months ago but hasn't done it since is not truly multi-skilled — they'll need re-training when you actually need them to step in.
Part 6: Cost Visibility
Material Costs
List your main material categories and annual costs, then calculate your cost ratio to sales.
Why material cost ratio matters: In garment manufacturing, materials typically account for 50–70% of the total cost of goods. If your ratio is higher, you may have waste problems in cutting (low fabric utilization), excessive defect rates causing material loss, or simply unfavorable material pricing.
If your material cost ratio is lower than industry average, verify that you're not compromising on material quality — because that will show up in customer returns.
Part 7: Throughput & Lead Time — How to Reduce Production Costs in Garment Manufacturing
Lead time is increasingly the competitive battleground in apparel manufacturing. Fast fashion has compressed timelines, and factories that can't deliver quickly lose orders to competitors with leaner operations.
Process Lead Times
Break down your lead time in half-day units for your main product:
- Fabric spreading time — Do you spread? How many hours?
- Spreading to finishing lead time — Total days
- Sewing process time — Days from sewing start to finish for a single item
- Cutting to delivery — Total days
The critical metric: Your sewing process time (#3) is the one you have the most control over. If it takes 5 days from sewing start to sewing finish for a single garment, that's almost entirely WIP sitting between processes. In a true one-piece flow system, a garment can go from first stitch to last in under 2 hours — the remaining time is the garment waiting, not being worked on.
Delivery Performance
- Who sets the delivery date — you or the client?
- How many deliveries in the past 6 months?
- How many were on schedule?
Calculate your on-time delivery rate: On-time deliveries ÷ total deliveries × 100. Below 90% is a serious problem. Your clients are tracking this even if you're not.
Part 8: Quality Systems & Defect Control
Quality problems are production problems in disguise. Every defective garment represents wasted labor, materials, and time.
Quality Inspection Methods
Which inspections do you conduct?
| Inspection Type | Conducted | Not conducted — want to? | No need |
|---|---|---|---|
| Fabric inspection | ☐ | ☐ | ☐ |
| Material inspection before sewing | ☐ | ☐ | ☐ |
| In-line inspection (parts finished) | ☐ | ☐ | ☐ |
| In-line inspection (main processes) | ☐ | ☐ | ☐ |
| Sewing finishing inspection | ☐ | ☐ | ☐ |
| Final inspection after finishing | ☐ | ☐ | ☐ |
The key principle: The earlier you catch a defect, the cheaper it is to fix. Fabric inspection catches problems before a single stitch is sewn. In-line inspection catches them before the garment is assembled. Final inspection catches them after all the labor is already invested — the most expensive time to find a problem.
If you're only doing final inspection, you're essentially letting defects travel the full length of your production line before catching them.
Annual Return Rate
What percentage of your total production is returned by clients?
Benchmark: Under 2% is acceptable for most product categories. Over 5% means quality control has systematic failures. Returns are the most expensive quality failures because they include shipping costs, re-inspection time, and customer relationship damage on top of the rework cost.
Defect Rate After Sewing
What percentage of items fail the final sewing inspection?
Benchmark: Under 5% is good. 5–10% is common but improvable. Over 10% means your processes have fundamental problems — either operators aren't trained properly, machines aren't maintained, or your quality standards aren't communicated clearly before production starts.
Rework Method
How do you handle defective products?
- ☐ Specialized rework operators handle repairs
- ☐ Mid-level managers (team leaders) handle repairs
- ☐ The operator who made the defect repairs it
- ☐ Other
Best practice: Having the operator who made the defect repair it is the most effective approach for reducing future defects — because the operator learns from the mistake. Dedicated rework operators are faster at fixing problems but create a system where production operators never see the consequences of poor quality.
The best factories combine both: the originating operator fixes it (learning opportunity), with rework specialists available for complex repairs that a production operator would take too long to fix.
Part 9: Management Maturity Scorecard — Lean Manufacturing Readiness for Garment Factories
This section is a health check of your management systems and lean manufacturing readiness. Answer honestly — "No" is a starting point, not a failure.
Management Level Checklist
| # | Practice | Yes | No |
|---|---|---|---|
| 1 | Do you conduct process analysis? | ☐ | ☐ |
| 2 | Do you set standard times for each process? | ☐ | ☐ |
| 3 | Do you assign tasks based on time (not intuition)? | ☐ | ☐ |
| 4 | Do you make scheduling plans based on data? | ☐ | ☐ |
| 5 | Is the daily target number displayed at each workstation? | ☐ | ☐ |
| 6 | Do you monitor material and supply inventory? | ☐ | ☐ |
| 7 | Do you track progress of each department daily? | ☐ | ☐ |
| 8 | Do you track daily output by individual worker? | ☐ | ☐ |
| 9 | Do you track daily production value per person? | ☐ | ☐ |
| 10 | Do you actively consider operators' opinions and feedback? | ☐ | ☐ |
| 11 | Is skill training conducted as a daily activity? | ☐ | ☐ |
| 12 | Is manager training conducted consistently? | ☐ | ☐ |
| 13 | Is efficiency improvement training conducted for operators? | ☐ | ☐ |
| 14 | Can simple equipment repairs be done in-house? | ☐ | ☐ |
| 15 | Do you record the quantity of returned items? | ☐ | ☐ |
| 16 | Do you record the quantity of defects within the factory? | ☐ | ☐ |
| 17 | Is production startup smooth after lot changeovers? | ☐ | ☐ |
| 18 | Is there a good balance of staff across all departments? | ☐ | ☐ |
How to interpret your score:
- 15–18 "Yes" answers: Your management systems are mature. Focus on optimization and advanced techniques (lean manufacturing, real-time monitoring systems).
- 10–14 "Yes" answers: You have a foundation. The items you answered "No" to are your improvement roadmap — prioritize standard times (#2) and data-based task assignment (#3), as these unlock many of the other practices.
- 5–9 "Yes" answers: Significant management gaps. Start with the basics: track daily output (#8), record defects (#16), and set visible daily targets (#5). These three practices alone will start driving improvement.
- Under 5 "Yes" answers: Your factory is running on intuition. This isn't sustainable as margins tighten and client expectations rise. Start with the simplest high-impact practice: display the daily target number at each workstation (#5). When people know the target, they work toward it.
The three most important items:
- #2 — Standard times. Without standard times, you can't balance a line, you can't quote accurately, and you can't measure efficiency. Everything else in production management flows from this.
- #3 — Time-based task assignment. If you distribute work based on "who usually does this" instead of measured process times, your line is unbalanced by default.
- #16 — Defect recording. You can't improve what you don't measure. Recording where, when, and what type of defects occur turns quality from a subjective judgment into a manageable system.
Part 10: Equipment & Capital Planning
Your machinery is both your production capability and one of your largest capital investments.
Major Equipment Inventory
List all your sewing machines and press equipment:
| Model Name | Model Number | Manufacturer | Quantity | Average Years of Use |
|---|---|---|---|---|
What to look for:
- Average age of equipment: Machines over 10–15 years old are likely less efficient, harder to maintain, and lack modern features (automatic thread trimming, electronic tension, programmable patterns) that save seconds per operation — and those seconds multiply across thousands of garments.
- Manufacturer mix: A factory using 5 different brands of lockstitch machines has 5 different maintenance procedures, 5 different parts inventories, and 5 different sets of quirks operators need to learn. Standardizing on fewer brands simplifies everything.
- Machine-to-operator ratio: If you have significantly more machines than operators, you either have good flexibility (spare machines for different processes) or dead capital.
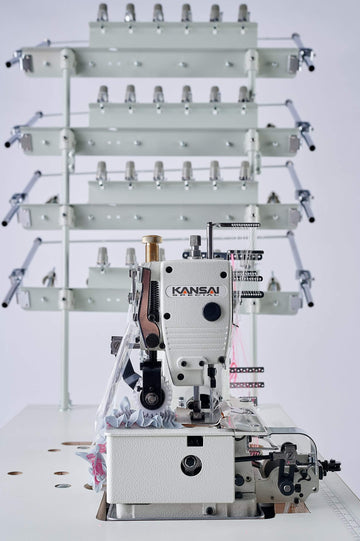
Automation in Sewing
List any automated or semi-automated machines in your sewing section.
Why this matters now: Automation in garment sewing has advanced significantly. Programmable pattern sewers, automatic pocket setters, and computer-controlled buttonhole machines can dramatically increase consistency and speed on repetitive operations. If your automation inventory is empty, you may be missing opportunities on your highest-volume processes.
Real example: One tactical backpack manufacturer we worked with doubled their production volume by integrating a single programmable sewing machine into their most repetitive operation. The right automation applied to the right bottleneck — that's where the ROI lives.
Preparation & Post-Process Equipment
Document your equipment for spreading, cutting, fusing, pressing, folding, and packing.
Digitalization of Management
Have you digitalized any management processes (production management, inventory management)? If so, what software do you use?
The current reality: Most small-to-medium garment factories still manage production with Excel spreadsheets and paper. This works — until it doesn't. If you're doing 10+ changeovers per month across multiple lines, paper-based tracking will miss things. If you're still considering digitalization, start with production tracking (daily output by line and operator) before trying to digitize everything at once.
Equipment Expansion Timing
When do you add new equipment?
- ☐ When a more efficient machine is released
- ☐ When the product item changes
- ☐ When production volume increases
- ☐ When new employees are hired
The strategic approach: Waiting until you need new equipment means you're always reacting. The best factories plan equipment purchases proactively — budgeting annually, evaluating new technology regularly, and replacing machines before they become unreliable rather than after they break down.
Annual Equipment Budget
Does your annual budget include funds for new equipment?
- ☐ Yes
- ☐ No
If "No," every equipment decision becomes an emergency purchase — made under time pressure, without comparison shopping, and often without considering whether the machine fits your future production plans.
Part 11: Non-Productive Time Audit — How to Calculate Sewing Operator Efficiency
This section goes deeper than the management checklist. For every factory we've audited, the single biggest source of lost productivity isn't slow sewing — it's everything that happens between sewing. Understanding and measuring these disruptions is the first step to calculating true sewing operator efficiency.
Rate each of the following disruptions on a 1–5 scale based on how often they occur in your factory:
1 = almost never, 2 = rarely, 3 = sometimes, 4 = often, 5 = very often
| # | Disruption Type | Examples | Your Score (1–5) |
|---|---|---|---|
| 1 | Setting up conditions | Checking instructions, adjusting machine settings, changing attachments, preparing and organizing the workstation | |
| 2 | Organizing the product | Preparing materials, moving materials between stations, checking availability, forming bundles | |
| 3 | Thread replacement | Changing upper thread, rewinding bobbins, rethreading | |
| 4 | Record-keeping | Filling out tracking sheets, updating boards, writing daily reports | |
| 5 | Machine malfunctions | Rethreading after thread breaks, machine jams, equipment failures | |
| 6 | Quality checking | Inspecting stitch quality and accuracy mid-process | |
| 7 | Rework | Unpicking and resewing, re-pressing, re-fusing | |
| 8 | Administrative tasks | Briefings, reporting, training sessions, consultations | |
| 9 | Material transport | Moving materials, products, and equipment between areas | |
| 10 | Operator movement | Walking within the work zone — to fetch parts, deliver finished pieces, or reach shared equipment | |
| 11 | Waiting | Waiting for materials, components, or accessories that haven't been delivered to the station | |
| 12 | Fatigue breaks | Unscheduled rest breaks outside of official break times | |
| 13 | Personal needs | Water, restroom, wiping sweat | |
| 14 | Distraction | Conversations, phone use, general inattention |
How to read your scores:
- Items scoring 4–5: These are your active production killers. Each one is directly reducing your daily output.
- Items scoring 3: These are brewing problems. They may not feel urgent, but they add up across hundreds of operators and thousands of operations per day.
- Items 9–11 (transport, movement, waiting): These three are pure waste — no value is being added. If any of these score above 2, your layout or material flow system needs redesign.
Pro tip: Walk your factory floor for 30 minutes with this list. Don't watch the sewing — watch everything except the sewing. You'll be surprised how much of your operators' day is spent on activities that produce zero stitches.
Part 12: Sewing Line Layout & Material Flow — How to Find Bottlenecks in Your Production Line
A bad layout multiplies every other inefficiency. If operators are walking to get parts, if cut pieces travel back and forth across the floor, if WIP piles up between stations — your sewing line layout is silently stealing output every hour. Finding and fixing these bottlenecks in your garment production line is often the single highest-ROI improvement a factory can make.
Do you have a floor plan of your facility?
Including cutting, sewing, and finishing areas? If not, draw one. You can't optimize what you can't see.
Does the product flow in a straight line through your facility?
The ideal flow: raw materials enter on one side, finished products exit on the other. Every U-turn, crossover, or backtrack in the flow path is wasted movement. Trace the path your most common product takes from cutting to packing — if it looks like a plate of spaghetti, your layout is costing you money.
Material accessibility checklist:
- ☐ Are materials and threads within arm's reach of operators?
- ☐ Is color/thread changeover fast? (How many minutes does it take?)
- ☐ Are materials organized and sorted by type?
- ☐ Can you identify the contents of material shelves at a glance?
- ☐ Does every material type have a designated storage location?
- ☐ Are active-use materials separated from inactive stock?
Every "No" on this list is a source of waiting time, searching time, or confusion — all of which show up as non-value-added time in your throughput analysis.
Part 13: Changeover Efficiency & Sewing Line Balancing
How is your sewing floor organized?
Option A — All lines sew the same product simultaneously: Every group works on the same item. Simpler to manage, but inflexible when you have multiple orders.
Option B — Each line/group sews a different product in parallel: Different groups handle different items at the same time. More flexible, but requires stronger management, clear process documentation, and multi-skilled operators.
Most factories evolve toward Option B as they grow. If you're still on Option A but struggling with order variety, the transition is worth planning for.
How big are your groups?
Typical range: 8–50 operators per line. Smaller groups (8–15) are more agile and easier to balance. Larger groups (30–50) have more specialization but are harder to rebalance when the product changes.
Is WIP accumulating on your assembly line?
If you see piles of semi-finished pieces building up between stations, your line isn't balanced. The station before the pile is faster than the station after it — that's your bottleneck. Fix the bottleneck, and the pile disappears along with the lost throughput.
Using Your Results
This assessment isn't a pass/fail test. It's a diagnostic tool. Here's how to use it:
Step 1: Identify your weak spots
Look at where your answers surprised you, or where you couldn't answer at all. Not knowing is often worse than a bad answer — it means you don't have visibility into that area. These blind spots are exactly what a professional audit is designed to uncover and quantify.
Step 2: Prioritize by impact
Not all improvements are equal. Focus on changes that reduce non-value-added time, improve throughput, and eliminate bottlenecks — these are where the 20%+ output gains hide.
Highest-impact areas for most factories:
- Setting standard times and using them for process distribution (your TPO and LDS)
- Training multi-skilled operators (workforce optimization)
- Implementing in-line quality inspection (not just final inspection)
- Tracking and displaying daily output targets
- Reviewing layout and operator movement paths for idle/travel waste
Step 3: Set a timeline
Pick one area to improve each quarter. Trying to fix everything at once leads to fixing nothing.
Step 4: Reassess regularly
Take this assessment every 6–12 months. Track your progress. Share results with your team. The factories that improve fastest are the ones that measure consistently.
Want an Expert to Do This With You?
This self-assessment gives you the questions. But interpreting the answers — and turning them into a concrete improvement plan — is where 45+ years of factory optimization experience makes the difference.
Prizzi Sewing Machine Co. offers a full 3-stage factory audit built on the same methodology behind this assessment:
Stage 1 — Product Model Assessment (5 business days): Our expert evaluates your top 3–5 SKUs, reviews your TPO and labor distribution, and identifies quick wins in your production documentation.
Stage 2 — Production Workflow Analysis (4–8 business days): An on-site visit to study your layout, observe operator movement, evaluate task distribution, and detect the bottlenecks that are costing you output every single day.
Stage 3 — Optimization Plan: A detailed, measurable plan with target KPIs — plus ongoing support as you implement it.
The results speak for themselves:
- A garment factory increased production volumes by 57%
- A footwear manufacturer scaled output by 3x
- A tactical gear maker doubled backpack production with a single automation upgrade
If you scored lower than you'd like on this self-assessment — or if you couldn't answer some questions at all — that's exactly what the audit is designed to fix.
Learn more about Prizzi's Formula for Sewing Success →
Ready to talk? Email Roman Kryvosheiev at roman@prizzisewing.com with the subject line "Factory Audit" — we'll schedule a free 30-minute consultation to discuss your assessment results.
Frequently Asked Questions About Garment Factory Optimization
How do I calculate sewing operator efficiency?
Sewing operator efficiency is calculated by dividing the standard time (SMV) of all pieces produced by the total minutes worked, then multiplying by 100. For example: if an operator produces 100 pieces of an operation with an SMV of 0.5 minutes in an 8-hour shift (480 minutes), their efficiency is (100 × 0.5) ÷ 480 × 100 = 10.4%. Industry benchmark: 50–60% is average, 70–80% is good, and above 80% is excellent. The gap between actual and standard time is your improvement opportunity — it includes all non-productive time (waiting, transport, setup, rework) that this assessment helps you identify.
What causes bottlenecks in garment production lines?
The most common causes of bottlenecks in sewing production lines are: unbalanced process distribution (one station takes significantly longer than others), single-skilled operators who can't be reassigned, machine breakdowns at critical stations, material supply delays, and poor layout that creates travel waste. Use a spaghetti diagram to trace the product flow through your factory — the point where WIP accumulates between stations is your bottleneck. Fix it by rebalancing the line using measured standard times, training multi-skilled operators who can float to bottleneck stations, or automating the bottleneck operation.
How do I balance a sewing production line?
Sewing line balancing starts with measuring the standard time (SMV) of every operation in the garment. Create a Technological Process Outline (TPO) listing all operations and their times. Then distribute operations across operators so each person's total workload is as close to equal as possible — this is your Labor Distribution Scheme (LDS). The target is to have each operator's workload within 5–10% of the line's average cycle time. Without measured standard times, line balancing is guesswork. The most common mistake is distributing work based on "who usually does what" instead of data.
What lean manufacturing tools work for apparel factories?
The most effective lean manufacturing tools for garment and apparel factories are: 5S (workplace organization), spaghetti diagrams (movement waste visualization), time studies and SMV calculation (process measurement), line balancing (process distribution optimization), one-piece flow (WIP reduction), visual management boards (daily targets displayed at workstations), and in-line quality inspection (catching defects at the source instead of at final inspection). Start with 5S and time studies — they cost nothing to implement and create the data foundation for everything else.
How much does a garment factory audit cost?
Professional garment factory audits typically involve 2–3 stages: a remote documentation review (5 business days), an on-site production workflow analysis (4–8 business days), and an optimization plan with target KPIs. The investment depends on factory size and complexity. Most factories see ROI within the first quarter after implementation — our clients have achieved production increases of 57% (garment), 3x (footwear), and 2x (tactical gear) through the improvements identified in audits. Contact us for a consultation →