

A garment factory called us with a familiar complaint: output was too low, overtime was constant, and the owner was considering a second shift. We measured one number — organization efficiency — and found it was 46%. Less than half the operators' capacity was being used productively. Six weeks later, that number was 85.6%. Daily output went from 376 pieces to 672. No new hires. No new machines. Here's exactly what changed.
This is the story of a production floor redesign — from diagnosis to results. The factory produced casual garments on a single assembly line with 15 operators. The product mix was stable (three core styles rotating monthly), and the equipment was adequate. On paper, everything should have worked. In practice, output had been stuck at 370-380 pieces per day for over a year.
The Diagnosis: What 46% Organization Efficiency Looks Like
Our audit team started where every production redesign should start: measuring each operator's work allotment time across the assembly line.
The results told the whole story. The fastest operator completed their cycle in 22 seconds. The slowest — the bottleneck — took 65 seconds. The pitch time (average across all 15 operators) was 30 seconds. Organization efficiency: 30 ÷ 65 × 100% = 46.2%.
That meant the line was running at less than half its theoretical capacity. For every minute the bottleneck operator spent sewing, the average operator spent 30 seconds sewing and 30 seconds waiting.
Three problems hiding in the numbers
| Problem | What We Found | Impact |
|---|---|---|
| Severe bottleneck | One operator handling collar attachment + topstitch + label — 65 seconds while neighbors averaged 30 | Entire line capped at 65-second pace |
| Poor layout | Products moved backward twice in the process flow — station 5 fed back to station 3, then forward again | Walking and confusion added 15-20% to actual cycle times |
| Unbalanced parts process | Parts (pockets, collars, cuffs) produced in batches too large for the assembly line's daily consumption | Excess WIP, storage clutter, and occasional parts shortages when the batch ran out |
Step 1: Process Redistribution
The first intervention targeted the bottleneck. The operator handling collar work (65 seconds) was doing three distinct sub-processes that could be separated:
- Collar attachment: 28 seconds
- Collar topstitching: 22 seconds
- Label insertion: 15 seconds
We moved the label insertion to the upstream operator (who had been at 22 seconds, now at 37 seconds) and the topstitching to the downstream operator (who had been at 25 seconds, now at 47 seconds). The former bottleneck dropped from 65 to 28 seconds.
But a new bottleneck emerged: the downstream operator was now at 47 seconds. So we looked further — the operator two stations ahead had only 18 seconds of work. We shifted one of her sub-processes downstream, creating a cascade of small adjustments across five stations.
After redistribution, the highest work allotment time on the line was 38 seconds. Pitch time remained at 30 seconds. Organization efficiency jumped from 46% to 79%.
Output immediately increased from 376 to approximately 530 pieces per day — a 41% improvement from process redistribution alone, without touching a single machine or changing the layout.
Step 2: Layout Redesign
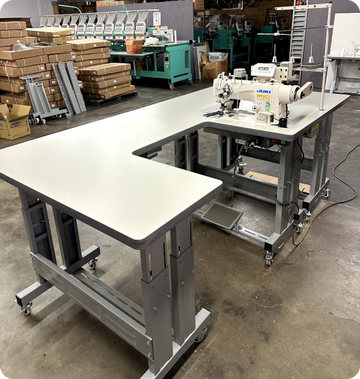
The process redistribution exposed a layout problem: the physical arrangement of machines no longer matched the new process flow. Two operators who now needed to pass work to each other were six meters apart.
We redesigned the layout using four principles:
- Forward flow — every product moves in one direction, left to right, through adjacent stations. No backtracking.
- Minimum distance — the outfeed side of each station is within arm's reach of the infeed side of the next. We installed material chutes between stations to eliminate carrying.
- Parts-to-assembly alignment — parts preparation stations positioned so finished parts arrive at the assembly line exactly where they're needed, not at a central staging area.
- Same machine type grouped — where the process allowed it, identical machines were placed adjacent so operators with similar skills could support each other during absences.
The layout change took one weekend. The factory stopped production Friday evening. Machines were moved Saturday. The team ran test production Sunday afternoon. Monday morning, the new layout was live.
Want an expert perspective? Prizzi's factory audit includes complete layout redesign as part of our Stage 3: Optimization Plan — we map your current flow, identify waste patterns, and design a new layout optimized for forward flow and minimum transport. Learn more about Prizzi's Formula for Sewing Success →
Step 3: Operational Improvements at Key Stations
With the new layout in place, we fine-tuned the remaining bottleneck stations:
- Folder attachments installed at two stations where operators were manually folding seam allowances — saved 4-6 seconds per piece at each station
- Parts bin repositioning at three stations where operators were reaching across their body to pick up input materials — saved 2-3 seconds each
- Work sequence adjustment at the pocket station where the operator was handling the piece four times instead of two — saved 5 seconds
These micro-improvements compressed the remaining bottleneck from 38 seconds to 35 seconds. Organization efficiency climbed from 79% to 85.6%.
The Results
| Metric | Before | After | Change |
|---|---|---|---|
| Organization efficiency | 46% | 85.6% | +39.6 percentage points |
| Bottleneck process time | 65 seconds | 35 seconds | -46% |
| Daily output | 376 pieces | 672 pieces | +79% |
| Operators | 15 | 15 | No change |
| Equipment | Same machines | Same machines | No change |
| Overtime | Regular (2+ hrs/day) | Eliminated | Salary cost savings |
The 79% output increase meant the factory could fulfill its entire order book within standard working hours. The second shift the owner had been considering became unnecessary. The investment: our audit fee, a weekend of machine relocation, and approximately $800 in folder attachments and material chutes.
Why This Result Is Typical, Not Exceptional
A 46% starting point is low, but not unusual. In our experience auditing sewing factories across garments, footwear, bags, and tactical equipment, organization efficiency below 60% is common in factories that have never measured it. The relationship between these numbers and output is mathematical, not aspirational — when you reduce the bottleneck time, daily output increases proportionally.
Other results from our audit portfolio:
- A garment factory: 57% output increase through process redistribution and line balancing
- A footwear manufacturer: 3× output after redesigning the assembly flow from batch to continuous
- A tactical gear producer: 2× backpack production by eliminating a single skill bottleneck with an equipment upgrade and cross-training
The common thread: none of these required significant capital expenditure. The output was already inside the factory — locked up in poor process distribution, layout waste, and bottleneck processes that nobody had quantified.
How to Start Your Own Redesign
You don't need to hire consultants to take the first step. Here's what you can do this week:
- Measure your organization efficiency — time every operator, calculate the pitch time, find the bottleneck, divide. If the result is below 75%, you have significant improvement available.
- Build a spaghetti diagram — trace the actual path products take through your factory. If the lines cross, double back, or travel unnecessary distances, your layout is costing you output.
- Identify your bottleneck — the operator with the highest work allotment time. Ask: can any of their sub-processes be transferred to a neighbor? Can their motions be simplified? Is their machine the right tool for the job?
If your organization efficiency is below 60%, a professional production redesign will almost certainly pay for itself within the first month of improved output.
Ready for a production redesign? Prizzi's factory audit team has delivered results like these for 45+ years. Our three-stage process — Product Model Assessment, Production Workflow Analysis, and Optimization Plan — takes your factory from diagnosis to redesigned layout with measurable output targets. Start with Prizzi's Formula for Sewing Success → or email roman@prizzisewing.com with the subject "Factory Audit."
Frequently Asked Questions
How long does a production floor redesign take?
The analysis and planning phase typically takes one to two weeks — measuring current state, designing the new process distribution, and creating the layout plan. The physical layout change can often be done in a single weekend. Most factories see measurable output improvement within the first week of running the new layout, with full results stabilizing within two to three weeks as operators adapt to the new flow.
Does a layout redesign require new equipment?
Almost never. In this case study, the factory used the exact same 15 machines — they were simply rearranged to support forward flow and reduce transport distance. Occasionally, a small investment in material chutes, passing tables, or folder attachments is needed (typically under $1,000), but the machines themselves rarely need to change.
What happens if my operators resist the change?
Resistance is natural — people are comfortable with their current station and process. Two things help: first, involve operators in the redesign by explaining what organization efficiency means and showing them the before-and-after math. Second, run test production before fully committing — a half-day trial on the new layout lets operators experience the smoother flow before it becomes permanent. When operators see that they're waiting less and producing more with less effort, resistance typically fades within a few days.
Can I achieve these results on a line that runs multiple styles?
Yes, but it requires recalculating the process distribution for each style. The organization efficiency will vary by style because different garments have different process times and bottleneck locations. A good production design accounts for this by creating process distribution charts for each major style and designing a layout that accommodates all of them — typically by optimizing for the highest-volume style while ensuring the layout still works for lower-volume variants.
Is 85% organization efficiency the ceiling, or can we go higher?
85% is our recommended target because it balances productivity with practical constraints — some variation between processes is unavoidable due to differences in sewing complexity. Achieving 90%+ is possible on simple products with short cycle times but becomes increasingly difficult on complex garments. The important thing is the direction: a factory that moves from 46% to 85% has captured the vast majority of available improvement. Going from 85% to 90% yields diminishing returns and may require trade-offs in flexibility. Focus on sustaining 85% across all lines before chasing higher numbers on any single one.

Co-Owner at Prizzi Sewing Machine Co.
Expert in sewing factory workflow optimization